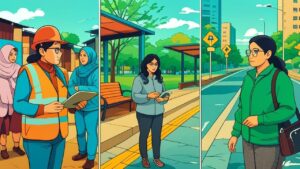
Urban planning is often seen as a technical field, filled with maps, blueprints, and models. But behind every design decision lies a question: Who is this space for? All too often, the answer is not “everyone.” Cities like Gurgaon have been designed with speed, efficiency, and corporate growth in mind, which frequently overlook the experiences of women, children and other marginalised groups. To bridge this gap, we need more than good intentions; we need systemic, actionable change informed by data. Gender-disaggregated data refers to information that is collected and analysed separately for different genders. This isn’t just a bureaucratic exercise; it’s a foundational tool for understanding how men, women, and non-binary individuals experience urban life differently. From commuting patterns and safety concerns to access to toilets or parks, such data helps urban planners move beyond assumptions and design for reality.
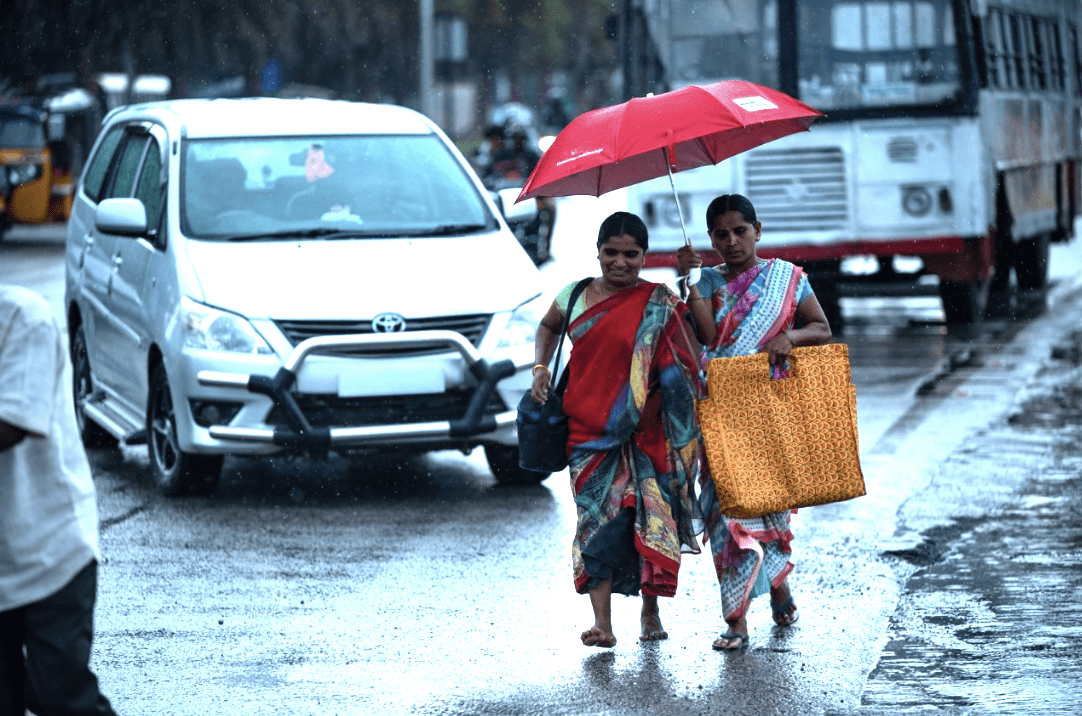
Mobility is one of the clearest examples of these gendered differences. According to the Delhi Gender Mobility Study (2022) by the Institute for Transportation and Development Policy (ITDP), only 13% of women use private vehicles for daily travel, compared to over 50% of men. Women rely far more on walking and public transport, and tend to make multi-purpose trips like combining school drop-offs, grocery shopping, and work. This is known as “trip chaining.”Yet, most transport systems remain designed around linear, peak-hour commutes, reflecting the routines of office-going men. This disconnect between actual usage and planning priorities makes it clear why data that captures lived realities is so important.
The gap becomes even more visible when we zoom in on Gurgaon. A 2019 UN Women report revealed that only 9% of women in the city feel comfortable using public transport after dark, and over 70% said they often alter their travel plans to avoid unsafe areas. However, conventional transport planning often fails to include such data, relying instead on ticketing and traffic numbers that don’t reflect gendered vulnerabilities.
Adding to the complexity, the perception of unsafety doesn’t always align with officially reported crime statistics. Interestingly, while the city’s official crime rate might suggest “low risk,” the perception of unsafety remains high. Official crime rates can be misleading because they often overlook underreported incidents, everyday harassment, and the lived experiences of fear and avoidance that shape how women navigate cities. This signals a crucial gap in planning logic without gender-specific data, while cities risk designing around averages that hide critical experiences.
Built environment and amenities, too, are shaped by these data blind spots. Less than 30% of public toilets in Indian cities meet female-friendly standards, which are lacking cleanliness, lighting, and safety features, creating significant constraints for women, especially those in informal employment.
So, “how can this data be gathered and used meaningfully?” Tools like Safetipin’s mobile app allow women to rate safety in public places based on lighting, visibility, density, and security. These geotagged inputs are mapped and shared with city planners and local governments. Likewise, participatory methods like Women’s Safety Walks bring local women into urban audits, helping planners see cities from a lived-experience perspective.
But data alone doesn’t create change; it must inform action embedded into policy. Gender-disaggregated insights should influence zoning, street design, transport routes, housing, and budgeting. For instance, if women avoid parks after 6 PM due to poor lighting, urban planners must respond not just by improving lights but by designing for constant, safe use throughout the day and night.
Ultimately, gender-disaggregated data shifts the conversation from “Is the city working?” to “Who is it working for?” Cities like Gurgaon can’t be truly modern if half the population must navigate them with caution, compromise, or fear.
Inclusion starts with visibility. When we design with the full picture in view, we build cities that not just function but are also caring.